Before purchasing a piece of equipment or making any investment in resources (e.g. software, tooling, programs, etc.), we start by describing how that piece of equipment will benefit PRIER. This is the thirty thousand foot view of how we are going to lower our cost of goods sold by making the investment. Typically, a new piece of equipment will drive down labor costs, increase quality, and possibly lower the cost of material (e.g. buying machinery to vertically integrate or purchasing tooling to diversify our suppliers).
Then, we dig into the details of those benefits we just described and analyze how that will affect cash flow. This is when we scrutinize each benefit driver and put our stake in the ground as to how that will save us money. For example, we recently built a customized body solder machine. One of the biggest benefit drivers of the new machine was the reduced amount of direct labor and time needed to produce the same output as before. We put a conservative estimate on the annual labor saved, as well as an estimate on the improved margin due to our increased capacity and better uptime. Then, we looked at the benefits of improved quality (i.e. less rework, returns, customer complaints, etc.), safety, energy, and anything else that generates recurring, annual savings.
Once we added up all of the annual savings generated from the investment, we put an implementation filter on the benefits because we may not realize 100% of what we anticipated. Typically, PRIER will use an 85% filter in the first year (this number should increase in the second and third year). When we multiple the total benefits by the implementation filter, we get our projected, total benefits realized for each year. See the example below:
|
BENEFIT DRIVERS |
YEAR |
|||
|
0 |
1 |
2 |
3 |
|
|
Greater margin driven by higher production capacity |
|
$4,500 |
4,950 |
5,445 |
|
Improved cycle time benefits: |
|
|
|
|
|
Reduced energy cost due to less running time |
|
180 |
198 |
218 |
|
Greater machine availability due to less downtime |
|
12,854 |
14,139 |
15,553 |
|
Reduced labor cost due to less running time |
|
21,622 |
23,784 |
26,162 |
|
Fewer accidents, resulting in less workers’ compensation |
|
308 |
339 |
373 |
|
Improved quality benefits: |
|
|
|
|
|
Fewer defects, resulting in less rework |
|
5,616 |
6,178 |
6,795 |
|
Fewer customer returns, resulting in less reprocessing costs |
|
1,342 |
1,476 |
1,623 |
|
Reduced time spent handling customer complaints |
|
520 |
572 |
629 |
|
Total annual benefits |
|
$46,941 |
$51,635 |
$56,799 |
|
Implementation filter |
85% |
90% |
95% |
|
|
$39,900 |
$46,472 |
$53,959 |
||
The next step is to determine the costs of the investment. In general, there is an initial investment cost (one-time cost), an implementation cost, training costs, and ongoing support costs. See below:
|
Initial investment |
Year 0 |
Year 1 |
Year 2 |
Year 3 |
|
Initial investment |
$59,000 |
$0 |
$0 |
$0 |
|
Implementation costs |
2,981 |
0 |
0 |
0 |
|
Ongoing support costs |
577 |
300 |
330 |
363 |
|
Training costs |
350 |
385 |
424 |
466 |
|
Other costs |
0 |
100 |
110 |
121 |
|
Total costs |
$62,908 |
$785 |
$864 |
$950 |
These estimates need to be summed on an annual basis and subtracted from the given years total benefits realized. Simply put, you take your total benefits realized and subtract your total investment costs for each year, and that equals your annual benefit flow as expressed below.
|
Benefits |
Year 0 |
Year 1 |
Year 2 |
Year 3 |
|
Annual benefit flow |
($62,908) |
$39,115 |
$45,608 |
$53,009 |
|
Cumulative benefit flow |
(62,908) |
(23,793) |
21,816 |
74,825 |
To determine when an investment pays back (in years), identify when the cumulative benefit flow returns a positive number. The cumulative benefit flow is just the summation of the annual benefit flow over time. In the example above, the cumulative benefit flow is positive in year 2 but negative in years 0 and 1. That means, the payback or the return on the investment happened sometime before the end of year 2. To get the exact number, just take the difference between the annual benefit flow and the cumulative benefit flow and divide that by the annual benefit flow (this number will always be less than 1). Then, add that decimal to the positive integer year before the cumulative benefit flow went positive. Again, if this happened in year 2, the payback would be > 1 but < 2.
In our example the equation would be: payback = 1 + ($45,608-$21,816)/$45,608
|
1.52 |
Other considerations or ROI measures include net present value (NPV). NPV is important because it helps us weigh different projects against each other to determine which has the greatest value. Obviously, the greater the NPV, the greater the potential impact on our business. Determining NPV can be done by assigning a cost of capital as the discount rate (![]() ) (i.e. the rate of return that could be earned on an investment with similar risk; generally between 5% and 15%) and using the annual benefit flow (starting in year 1) as the net cash flow (
) (i.e. the rate of return that could be earned on an investment with similar risk; generally between 5% and 15%) and using the annual benefit flow (starting in year 1) as the net cash flow (![]() ) over a given period of time (
) over a given period of time (![]() ) (typically, at PRIER, we want our payback to come within 3 years, so time equals years 1 through 3).
) (typically, at PRIER, we want our payback to come within 3 years, so time equals years 1 through 3).
Here’s the formula:
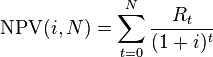
Then, you must subtract the total cost of the investment in year 0 (i.e. the initial annual benefit flow) to determine the NPV. If you use excel, it’s much simpler, just take =NPV(![]() ,
,![]() ,)+(year 0 Annual benefit flow). The equation for our example is: =NPV(7.5%,$39,115,$45,608,$53,009)-$62,908 (see below)
,)+(year 0 Annual benefit flow). The equation for our example is: =NPV(7.5%,$39,115,$45,608,$53,009)-$62,908 (see below)
|
Benefits |
Year 0 |
Year 1 |
Year 2 |
Year 3 |
|
Annual benefit flow |
($62,908) |
$39,115 |
$45,608 |
$53,009 |
|
ROI measures |
|
|
Cost of capital |
7.5% |
|
$55,615 |
As you can see, there’s more than just a “gut feeling” in determining which project(s) make sense. However, when we make a decision to invest our resources into a project, we have the confidence to act swiftly and the wherewithal to recognize any hidden costs that may have been missed. Now, do we always realize every benefit and account for every cost? Of course, we are not perfect. However, by doing this practice, we have greatly improved our estimates on both sides of the equation, and we are much more honest with ourselves when making investments. In the end, we just want to do the right things for the right reasons, and this best suits us to choose the best projects to increase our customer value.
Follow PRIER on: Facebook, Twitter, LinkedIn, Pinterest and YouTube!